Seven Stages.
A Different Way to Plan.
The seven stages form the core methodology of Advanced Urban Visioning. Each stage addresses a specific learning question and builds the understanding needed for the next—from understanding transit’s competitive position to identifying effective solutions, reducing their costs, and sequencing investments that strengthen the network.
Advanced Urban Visioning emerged from the practical application of David Korten’s Learning Process Approach. Successful projects learn in this order:
Conventional project development often begins with idea generation, before establishing what would actually produce the desired outcomes. The resulting proposals may reflect familiar solutions without building from an understanding of the factors needed to achieve regional goals.
AUV works backward from those goals, allowing solutions to emerge from evidence about how to produce results.
The core methodology
The seven stages of Advanced Urban Visioning
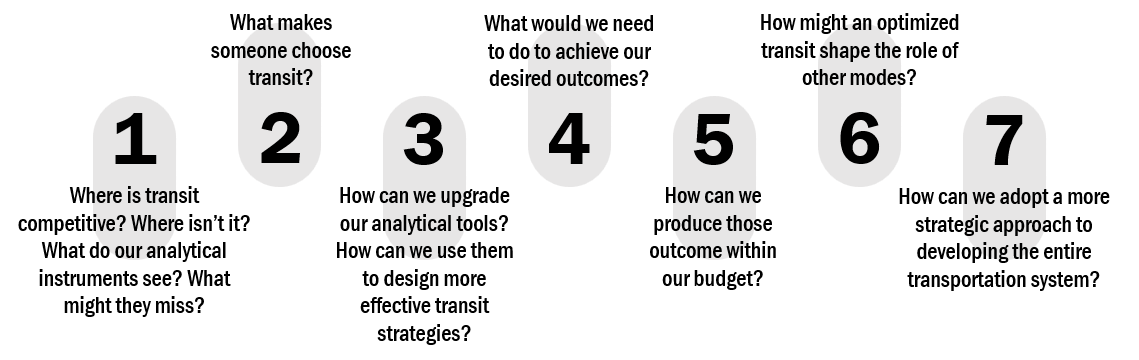
01Establish transit’s competitive baseline and understand the capabilities of existing tools.
Map connectivity, access to destinations, and transit’s time competitiveness relative to driving across regional and localized trips. Identify the levels of customer experience available to different communities. Collaboratively stress-test existing modeling tools to clarify their strengths and limitations when evaluating new approaches.
02Learn what makes transit more useful to more people, more of the time.
Use qualitative and quantitative research to understand existing and potential riders: where they are, which trips they make, and what would lead them to choose transit. Identify what set of connections, which travel time savings, and which user interface/customer experience factors matter most to potential riders.
03Incorporate market research findings into analytical tools to help design and identify more effective transit strategies.
Incorporate the research findings into travel models and exploratory tools so they better reflect what matters to existing and potential riders. Use these tools to test how changes in network design, travel times, and customer experience affect transit’s competitive position and its ability to attract and serve more riders.
04Learn what combination of factors would be required to achieve the region’s desired outcomes.
Explore a range of network configurations to identify what combination of connectivity, travel times, access, customer experience, and land-use relationships could produce the region’s desired outcomes—real results. Use these findings as benchmarks to identify opportunities that improve the performance of the region’s existing plan.
05Learn how to produce the desired outcomes efficiently.
Identify which service and network attributes are essential to achieving the desired results, then explore how to minimize the capital and operating costs of producing them. Evaluate modes, technologies, infrastructure designs, and partnerships that preserve those benefits while bringing solutions within expected budgets. Use a design process to incorporate synergies with bicycle, pedestrian, automotive, public space, and green space goals and projects.
06Learn how an optimized transit system changes the region’s broader infrastructure needs.
Reverse the usual planning order: first evaluate what optimized transit, bicycle, and pedestrian networks can achieve, then reassess roadway needs in light of their effects on travel demand and traffic. Identify where roadway investments remain necessary and where capacity, design, or timing could change.
07Learn how the system should evolve.
Develop a sequence of investments that produces useful results at each stage. Identify how small each increment can be while improving connectivity, travel time, customer experience, ridership, or operating costs. Design each investment to deliver benefits when it opens, increase the value of existing infrastructure, and create opportunities for subsequent improvements to strengthen network effects.
Make the possibilities visible.
Exploratory Simulations
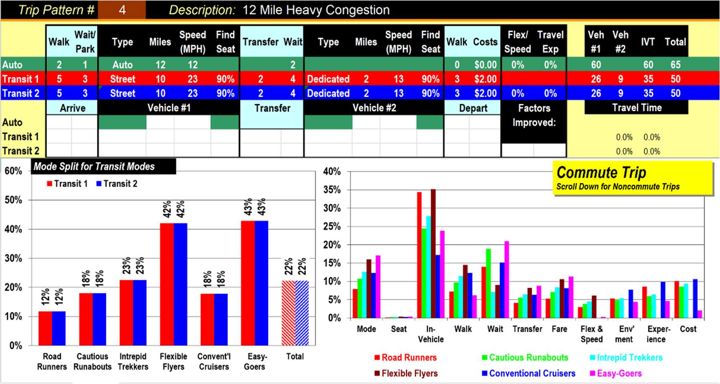
The Center for Advanced Urban Visioning develops state-of-the-art tools that turn market research into instruments for exploring and comparing how interventions could affect market share—and identifying where the greatest gains can be made. These are learning, exploratory, and planning tools that help reveal which combinations of network design, travel time, and customer experience offer the greatest potential.
Mapping Transit System Effectiveness (TSE)
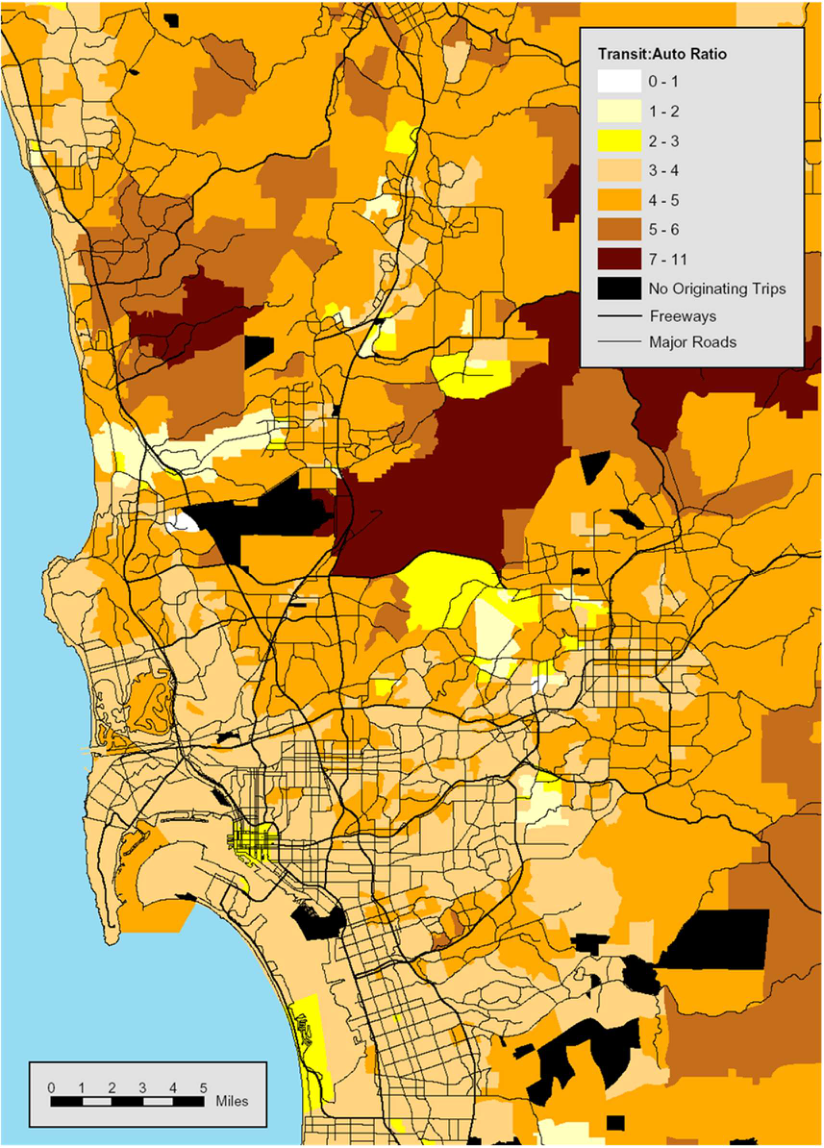
Map transit’s time competitiveness, connectivity, and access to regional opportunities. Reveal gaps affecting underserved communities, and compare the transportation impacts of infrastructure, service, or land use interventions using TSE measures.
Environmental Justice: connecting communities with opportunity
AUV compares transit effectiveness in Environmental Justice communities with that in other communities, revealing differences in connectivity, travel-time competitiveness, and access to regional opportunities. Its learning and design process helps identify how to meet those communities’ transportation needs more effectively—and evaluate how proposed improvements would change those outcomes.